Equi-note 20 Hyperflexion-rollkur-the horse is more conflictive because faster airflow is turbulent and abrasive
Simulation of airflow around a car model
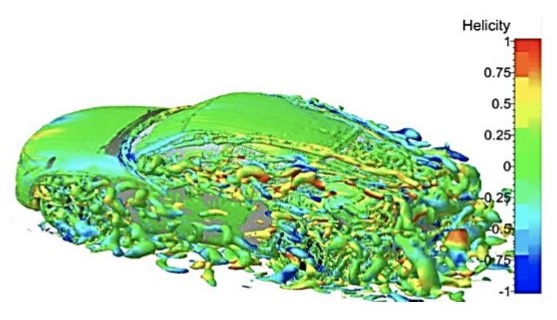
Source: “Numerical simulation around a realistic generic car model with different rear profiles” by E. Guilmineau, Ecole Centrale de Nantes, France, HAL Id: hal-01202486 [email protected] Jun 2014. open access
Equi-note 20
Hyperflexion-rollkur-the horse is more conflictive because faster airflow is
turbulent and abrasive
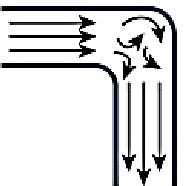
The movement of fluids, including air, is very complex. It is affected by a wide range of factors including air pressure, temperature, viscosity, speed, shapes, lengths and surfaces of tubes, etc. The complexity of air movement can be seen from the image shown above. These show the external effects only, without the added dynamics of the internal piping of the horse’s breathing mechanism.
The two main influences being focussed on in this post are curvature and constriction. The above example of the turbulence created by a car shows one form. Other effects are created in the horse’s breathing process. How they are created is explained next.
“Chapter 4: Flow and Velocity” by Brian S. Freeman, MD, McGraw-Hill 2014, Anesthesiology Core Review:
“Flow is different than velocity. Velocity is defined as the distance a given fluid moves within a unit of time, most commonly expressed in centimeters per second. The flow of a fluid within a tube is related to velocity by the relationship F = V ⋅ r2, where V is the mean velocity and r is the radius of the tube.
PATTERNS OF FLOW
There are two types of flow patterns:
Laminar
Fluids assuming laminar flow contain molecules that move in numerous thin layers or concentric tubes that are known as streamlines. There are no fluctuations. Successive particles within each sheet will pass the same point at the same steady velocity. Although laminar fluid particles move in a straight line, each streamline has a different velocity. Molecules in the center of the flow have the highest velocity, whereas those at the periphery of the tube are almost motionless. Fluids flow in a laminar pattern when they have low flow rates through smooth tubes with large cross-sectional areas, such as at the lung periphery. Laminar flow is directly proportional to the pressure gradient (F∝ P).
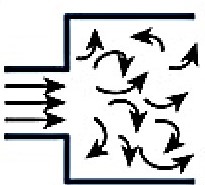
Turbulent
Turbulent fluid flow contains molecules that move in irregular directions due to eddy currents. The disordered nature of turbulent flow increases resistance to flow. Turbulent flow typically occurs when fluid particles move at higher rates but with fluctuations. Unlike laminar flow, turbulent fluids have a nonlinear relationship between flow and pressure. The flow rate is proportional to the square root of the pressure gradient (F∝ √P). To increase turbulent flow twofold, the pressure gradient requires a fourfold increase. This is why laminar flow patterns are preferable to turbulent ones. Turbulent fluids are less efficient; they require higher energy to generate the greater pressure differential necessary to achieve an identical flow rate as laminar fluids. For example, if the airflow in the upper airways becomes more turbulent due to an obstruction, the patient will require greater work of breathing …”
Laminar vs turbulent flow
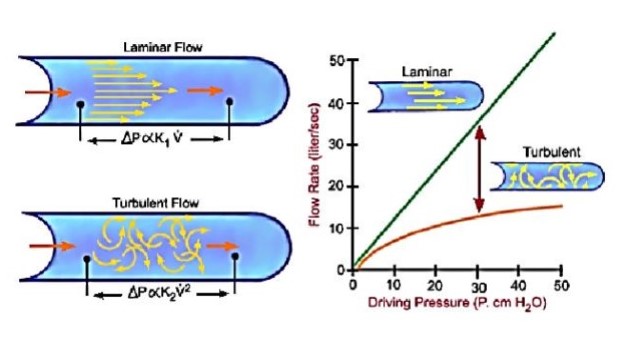
Source: “Laminar vs Turbulent pressure/flow rate relations”; McGill 2011
Moving on from the two types of flows, the next issue to address is the shape of the pipe in which the fluid is flowing.
“Bends, Flow and Pressure Drop”: by Jayanti Sreenivas DOI: 10.1615/AtoZ; 2 February 2011:
“The main feature of flow through a bend is the presence of a radial pressure gradient created by the centrifugal force acting on the fluid. Because of this, the fluid at the center of the pipe moves towards the outer side and comes back along the wall towards the inner side. This creates a double spiral flow field shown schematically in Figure 1″.
Fig. 1 Double spiral flow in a bend
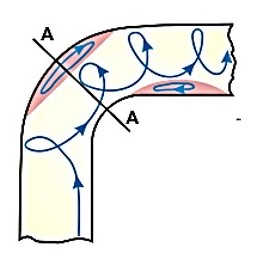
Source: “Double spiral flow in a bend, longitudinal section”: Idelchik, 1986, wp
Main causes of turbulant airflows
There are various conditions which can create turbulent flows, as the next extract and images indicate.
“Applied Respiratory Physiology”; by J.F. Nunn, University of Leeds, ed. 4, 1993, Butterworth-Heinemann:
“Turbulent flow-Flow in tubes below the critical flow rate remains mostly laminar. However, at flows greater than the critical flow rate, the flow becomes increasingly turbulent. Under turbulent flow conditions, the parabolic flow pattern is lost and the resistance to flow increases with flow itself. Turbulence may also be created where sharp angles, changes in diameter and branches are encountered.”
Main causes of turbulant airflows
High flow rates
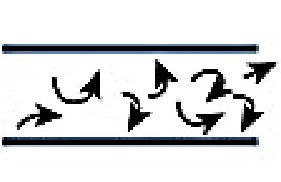
Sharp angles
Changes in diameter
Key reasons why faster airflow is more turbulent and abrasive have been
indicated
However, the equine condition has not been the subject of scientific research to the same extent as it has been for humans. Consequently some valuable lessons from human research are quoted next that will provide deeper insights. The next extracts will analyze the effects of curvature and constriction in the tracheas of human patients.
The effects of curvature and constriction in the tracheas of human patients
have lessons for horsecare
“The effects of curvature and constriction on airflow and energy loss in pathological tracheas” May 2016; by A.J. Bates a,∗, R. Cettoa,b, D.J. Doorlya, R.C. Schroter c, N.S. Tolley b, A. Comerforda a Department of Aeronautics, Imperial College London, United Kingdom b Department of Otolaryngology, St. Mary’s Hospital, Imperial College Healthcare Trust, United Kingdom c Department of Bioengineering, Imperial College London, United Kingdom.This is an open access article under the CC by license:
“The primary purpose of the present paper is to demonstrate how CFD/computational fluid dynamics simulations of tracheal flow can enhance understanding; of the relationship between pathological tracheal anatomy and losses of pressure and energy. CFD simulations were performed in airways affected by goitres (with differing geometric consequences) and a normal geometry for comparison. The jet emanating from the glottis displayed different impingement and breakdown patterns in pathological geometries; and increased loss was associated with curvature.
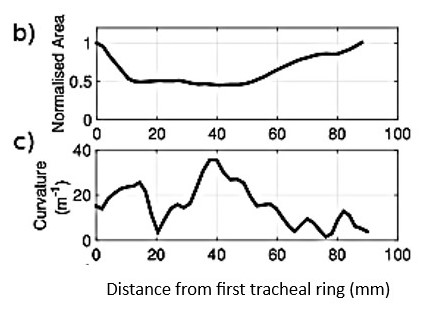
Case B which is analyzed below suffers two consequences of the goitre. It is constricted as evidenced by a sustained reduction in area between x = 10 and 50 mm distal to the first tracheal ring. (see Fig. 5b) Moreover, case B is displaced from the normal alignment of the trachea; as shown by a gradual rise and fall in curvature between x = 20 and 65 mm (maximum curvature: 0.036 mm−1; see Fig. 5c)”.
Obstruction causes decrease in tracheal area (b) and rise and fall in curvature (c)
“These changes alter the flow: Fig. 5a shows that the jet emanates from the glottis and impinges onto the anterior wall; the location of impingement is closely correlated with the projection of the glottal plane in its normal direction. In this upper region the influence of curvature and torsion (how sharply the centreline twists in space) seem to be negligible. Downstream of the constricted region (x > 50 mm) the lumen expands and the jet no longer dominates the flow; curvature and its direction now have a larger influence. (evidenced by the Frenet normal vectors that point towards the centre of curvature in Fig. 5g)” .
(a) Upper region dominated by jet/lower region dominated by curvature
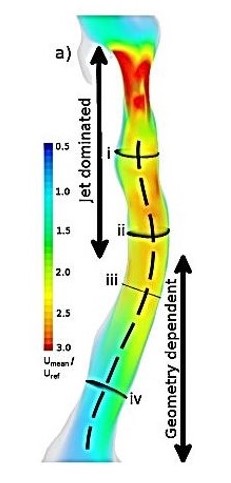
Note: (a) Volume rendering of mean velocity scaled by Uref, the mean velocity in the plane across the first tracheal ring, with centreline overlaid.
As the airflow moves along the trachea it creates a series of currents, eddies and variable speeds. Shown next.
g) Cross sectional planes-i-iv along trachea
(colours show air velocity and location)
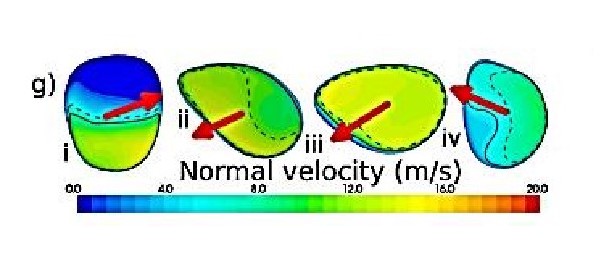
Note: (g) The solid black line demarks the proportion of the area covered by UAMAX, whilst the dashed line shows UAMEAN. The red arrows indicate the direction of the Frenet normal vector.
The complexity of the airflow needs to be understood
By way of perspective, it will be useful to have these statistics expressed in a more commonly used metric. They make it very obvious why the horse becomes conflictive since when its airflow reaches 500 kph it is bound to become abrasive. Earlier speeds have indicated an overall increase in speed, but now the human component also shows that speeds differ in various parts of the trachea.
This conversion involves changing the speeds from m/s to mph/kph, as follows:
i. blue zone-mid-point 20 m/s 44.7 mph/72 kph
iii. yellow zone-mid-point 140 m/s 313.2 mph/504 kph
The indicator UAMAX is a critical element in understanding the airflow. The following descriptions which refer to the diagram below explain why.
“The area UAMAX is the section of the cross-sectional plane. It is where the local plane-normal velocity, U ·nˆ is above half the maximum U ·nˆ on that cross-section. (nˆ being the normal unit vector to the plane). The metric UAMAX quantifies the degree of flow non-uniformity; which is an inevitable consequence of curvature and constriction.
Following impingement and breakdown, UAMAX rises suddenly due to redistribution of high velocity fluid through the cross-section. Through the throat of the constriction UAMAX remains elevated”.
(e) The distribution of UAMAX along the trachea
(f) Mean turbulent kinetic energy/TKE along the trachea
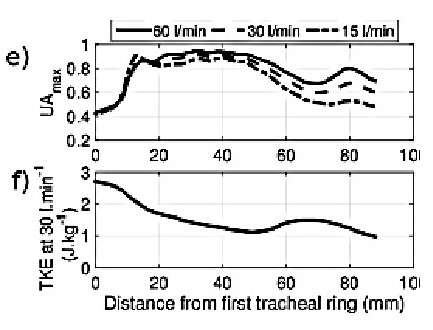
Note: the above analysis of TKE is based on the measure of Joules (1 Joule/kg=0.0002388459 cal/g).
The concept of TKE was described in the previous post in a quote from Cadence CFD, in “A Guide to Understanding Turbulent Kinetic Energy” which stated that: “Turbulent kinetic energy is the quantitative measure of the intensity of turbulence for a given flow”.
The velocity of airflow is automatically accompanied by energy flux. This is defined as the rate of transfer of energy through a surface.
Fig. 4 Energy flux is 6 times higher for Case B vs A
(note the values expressed in the vertical axis)
A=Normal B=Curved&Constricted
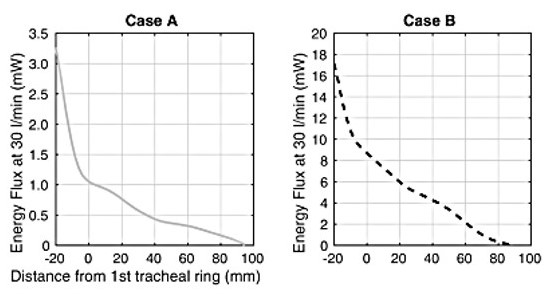
Ths significance of the above diagram is revealed in the following quote.
“The values of energy flux through the glottis and trachea shown in Fig. 4 can be put into context; by comparing them to values for the work of breathing reported in the literature. Loring et al. (2009) report that in normal cases, the resistance to airflow in the airways is of order 30 mW; and the total work rate is of order 300–350 mW (Milic-Emili and Petit, 1960; Loring et al., 2009).
Therefore, comparison of these values with the 3 mW of energy flux required to drive flow through the normal glottis and trachea (Fig. 4, case A) reveals that approximately 10% of the airway resistance occurs in the larynx and trachea in normal cases; and approximately 1% of the total work rate of breathing. The pathological cases (e.g. case C) show this tracheal contribution can increase almost 30 fold; and would therefore relate to a 30% increase in the work of breathing, all else being equal.”
“Conclusions
Goitres have been used as a tool, creating suitable geometries to investigate changes in airway curvature and constriction. This study suggests that geometric factors beyond those previously considered have a profound effect on the pressure and energy losses during inspiration within the trachea. Such geometric factors include curvature, glottal alignment and deviation.
In this study, the influence of pathology on these measures was found to increase the exponent of the pressure flow relationship and raise pressure and energy losses and consequently the required work of breathing.
Flow in the trachea is normally dominated by the upstream laryngeal jet. Changes due to pathology influence the behaviour and breakdown of this jet in addition to changes in the affected anatomical region. Formulae to predict tracheal losses based purely on the degree of stenosis, such as that proposed by Brouns et al.(2007) are specific to the nature of the idealisation of their geometry; and thus may not represent the conditions found in vivo.
The cases presented in this study demonstrate that coupling between geometric factors such as curvature and the alignment of the laryngeal jet can be equally important as the degree of stenosis”.
The above examples are derived from the human experience. They are important because they show that the level of sophistication of analysis for humans is a world apart from that applied to horses. This underlines the importance of drawing from the human experience and applying the relevant lessons to horses.
“Pharyngeal diameter in various head and neck positions during exercise in sport horses” Li-mei Go1*† , Ann Kristin Barton1,2† and Bernhard Ohnesorge 2014 1Clinic for Horses, University of Veterinary Medicine Hannover, Bünteweg 9, Hannover D-30559, Germany 2Department of Veterinary Medicine of Freie Universität Berlin, Equine Clinic, Oertzenweg 19 b, Berlin D-14163, Germany
“Dynamic stenosis of the upper airways occurs when the soft tissue of the upper airways can no longer withstand the high changes in pressure during exercise; and structures of the nasopharynx or the larynx collapse into the lumen, thus leading to airflow obstruction. Due to its musculomembraneous structure without osseous or cartilaginous support, the pharynx in particular is prone to changes in pressure and airflow during exercise”.
“Dynamic collapse of the upper respiratory tract: A review”; S. H. FRANKLIN, Department of Clinical Veterinary Science, School of Clinical Veterinary Science, University of Bristol, Langford BS40 5DU, UK EQUINE VETERINARY EDUCATION / AE / April 2008
“Dynamic collapse of the upper respiratory tract is a common cause of poor performance in athletic horses. Most commonly, airway obstruction occurs during strenuous exercise when the upper respiratory tract is exposed to high pressure swings. In horses undertaking submaximal exercise, the pressures may also be increased due to flexion of the neck. The nasopharynx and larynx are particularly prone to dynamic collapse; and a number of different forms of upper airway obstruction are now recognised. However, due to the dynamic nature of the collapse a definitive diagnosis is often not possible from resting observations alone.”
This post covers a subject which is closely related to the previous Equi-note #18. A link is provided below.