Equi-note 19 Hyperflexion-rollkur-the horse is more conflictive because extra needed air gets caught in two key entrapment areas
Respiratory tract obstructions
Source: “Airflow mechanics in models of equine obstructive airway disease under conditions simulating exercise” by Warwick Bayly 1997; wp
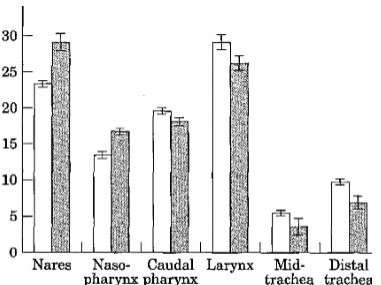
The authors provide the following comments on the above chart: “It shows that the nares, and the larynx were the sites of greatest resistance. Least resistance was found in the mid- and distal trachea. Reynolds numbers for the trachea increased with flow and rose from 28,000 to greater than 63,000 over the flow range used in the study. This indicates that even at low flow rates, some turbulence of airflow was created in the upper airway.”
Equi-note 19
Hyperflexion-rollkur-the horse is more conflictive because extra needed air gets caught in two
key entrapment areas
The above image shows where obstructions are most likely to occur as well as their severity. A description of the methodology used to determine this outcome follows.
“Airflow mechanics in models of equine obstructive airway disease under conditions simulating exercise”; by W. M. BAYLY, Department of Veterinary Clinical Sciences, Washington State University, Pullman, Washington USA, R. F. SLOCOMBE, School of Veterinary Science, University of Melbourne, Parkville, Victoria, Australia research in Veterinary Science 1997, 62, 205-211
“SUMMARY
Effects of respiratory tract obstructions on ventilatory mechanics in horses exercising at high speeds were tested with a fibreglass replica of the airways (nares to mainstem bronchi) of an adult horse. Segmental pressures were recorded at six sites along the model at four different uni-directional flows (1300 – 4100 litre min-1), and the respective resistances (R) to airflow were calculated. The external nares and the larynx made the greatest contributions to the total resistance (RToT) when no obstruction was present”.
“In image shown above, relative contributions of resistances in different anatomical segments in a fibreglass model of the equine extrathoracic respiratory tract were made. This was for both a clear airway and pharyngeal lymphoid hyperplasia (PHL) condition determined using four different flows in the continuous flow preparation of the model.* Indicates a value that was significantly different to that generated at the same site with the other form of the model, Key: [] clear airway; • PLH model”.
There is a further essential point to note given its application to riders and trainers.The physiology of the horse is structured in such a way that there are two main areas of blockage. They are created by the rider/trainer. How?
The methods used are shown in the next two images, via a) a tight noseband and b) tight reins. Each method restricts airflow, but in different ways.
Tight noseband blocks airflow through nostrils
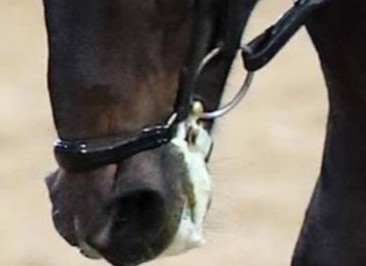
Source: https://theclassicalhorse.tumblr.com/Combining Dressage with Clicker Training;
Tight reins block trachea
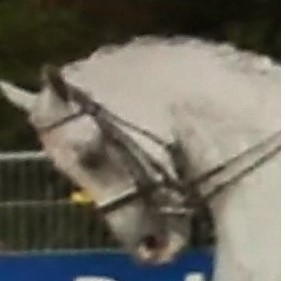
Source: nkc
The horse’s main respiratory organs
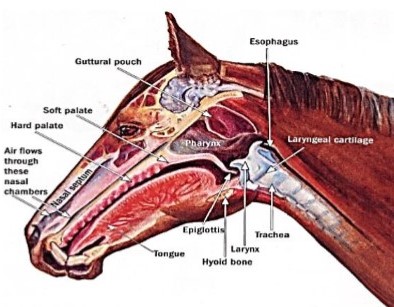
Source: flairstrips.com.
It can be noted from the above two charts the location and identity of the two main areas of blockage. They are the nares and the larynx. These are precisely the two areas most affected by human intervention: the noseband in the case of the nares and the neck compression caused by the hyperflexion-rollkur in the case of the larynx.
This subject is analyzed further in the following extract, which was conducted 11 years after the first study quoted above and logically reflects new developments and technology.
“Development of equine upper airway fluid mechanics model for Thoroughbred racehorses”; by V. RAKESH, N. G. DUCHARME* †, A. K. DATTA, J. CHEETHAM† and A. P. PEASE‡ Department of Biological and Environmental Engineering, College of Agriculture and Life Sciences, and †Department of Clinical Sciences, College of Veterinary Medicine, Cornell University, Ithaca, New York 14853; and ‡Department of Molecular Biomedical Sciences, College of Veterinary Medicine, North Carolina State University, Raleigh, North Carolina 27606, USA; USA EQUINE VETERINARY JOURNAL Equine vet. J. 2008; images wp:
“The airflow velocity and static tracheal pressure were comparable to data of horses exercising on a high-speed treadmill reported in recent literature. During inspiration, the area of highest turbulence (i.e. kinetic energy) was in the larynx, the rostral aspect of the nasopharynx was subjected to the most negative wall pressure and the highest airflow velocity is more caudal on the ventral aspect of the nasopharynx (i.e. the soft palate). During exhalation, the area of highest turbulence was in the rostral and mid-nasopharynx, the maximum positive pressure was observed at the caudal aspect of the soft palate and the highest airflow velocity at the front of the nasopharynx.
Conclusions and clinical relevance
In the equine upper airway collapsible area, the floor of the rostral aspect of the nasopharynx is subjected to the most significant collapsing pressure with high average turbulent kinetic during inhalation, which may lead to palatal instability and explain the high prevalence of dorsal displacement of the soft palate (DDSP) in racehorses. Maximal abduction of the arytenoid cartilage may not be needed for optimal performance, since the trachea cross-sectional area is 7% smaller than the rima glottidis.”
Model of equine airway
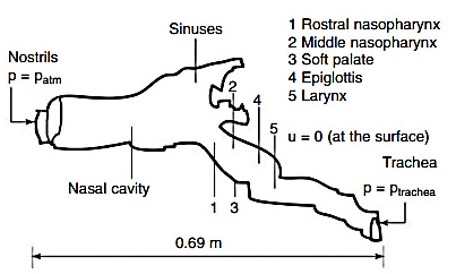
Note on above image: Schematic of the computational domain used for the model. The schematic shows the different slices across the airway used in the analysis. Pressure at the nostrils was set to the atmospheric pressure (p = patm), and tracheal pressures were set as a function of time (p = ptrachea). The tracheal pressures are shown in Fig 2 (a) below. At the airway wall, the velocity of air was zero (u = 0).
Tracheal pressures at inhalation and exhalation
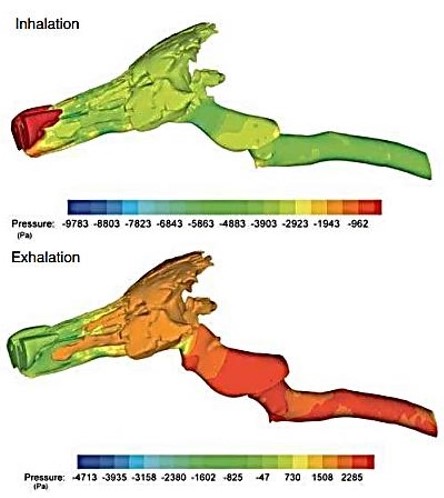
Fig 4: Computational model of equine airway showing the static pressure contours on the wall of the upper airways during inhalation and exhalation at peak exercise corresponding to a pressure of 4336 Pa (inhalation) and 3068 Pa (exhalation) in the trachea.
Geometric and respiratory parameter values during inhalation at various sections of the
equine upper airway
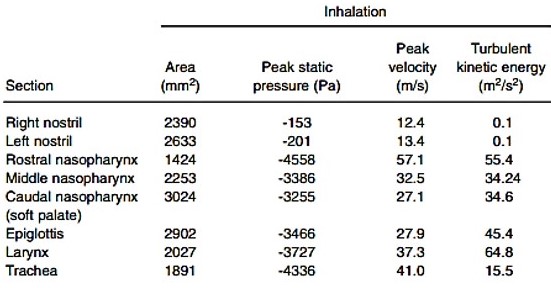
Note: The pressure, velocity and turbulent kinetic energy values are mean values calculated based on areas of the different sections.
The velocity in terms of m/s may be more meaningful to have these figures (both minimum and maximum) converted to mph/kph.
12.4 m/s = 27.7 mph/44.6 kph
57.1 m/s = 127.7 mph/205.5 kph
These figures have been modelled for a horse’s windpipe, whereas the estimates quoted in a previous blog post referred to a hosepipe. In both cases a violent increase in speed is clearly evident.
There are extreme changes in air pressure between inhalation and exhalation
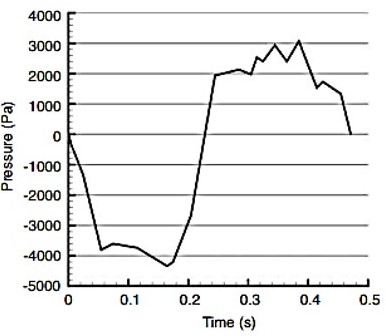
Pressure conversion from pa (pascals) to kg:
– 4000 pa = -407.9 kg/m²
+ 3000 pa = +305.9 kg/m²
Both air pressure and speed combine to create turbulent kinetic energy. This is looked at next.
“A Guide to Understanding Turbulent Kinetic Energy”; by Cadence CFD https://resources.system-analysis.cadence.com/blog/msa2022:
“What Is Turbulent Kinetic Energy? Turbulent kinetic energy is the quantitative measure of the intensity of turbulence for a given flow. It can be measured as the root mean square of the fluctuation in flow velocity. In fluid dynamics, it can simply be defined as the mean kinetic energy per unit mass for a turbulent flow. Mathematically, kinetic energy can generally be expressed as the following equation. Note that m= mass and v= velocity”.
Kinetic energy=½mv²
The two following extracts explain this process further.